
Worldly Product Impact Calculator Methodology
Version 2.0 (Last update: December 2025)
This document is WORLDLY CONFIDENTIAL. WORLDLY employees may share the link to this document directly with external parties.
Purpose
The purpose of this document is to describe the methodology of the Worldly Product Impact Calculator (PIC).
Product Impact Calculator Overview
The Product Impact Calculator (PIC) includes Scope 3:
- Category 1 - Purchased Goods
- Category 4 - Upstream Transportation
- Category 9 - Downstream Transportation
- Category 11 - Product Use
- Category 12 - End of Life (EOL)
The basic version of our model uses the average-data method for calculating Scope 3, Category 1 as described in the Scope 3 Calculation Guidance.1 Within the tool, we also give users the ability to move to a blended approach that substitutes generic data for primary data (moving them to the hybrid data method) for the Scope 3 Category 1 inputs that are described in detail below.
The Product Impact Calculator includes default product impact models across hundreds of product categories. A library of industry average materials, components, and packaging options serves as the foundation for these default product impact models, and is available to all PIC users. The full and regularly updated list of product categories, materials, components, and packaging is maintained in the PIC Product Category and Material details) ). These default product impact models are built from a library of industry average materials, components, and packaging options that are available for all tool users. Default product models are available across some categories; other categories do not yet have a default available. Users can build their own models for categories that do not have defaults by inputting their Bill of Materials. We continue to expand the list of default product models, as the category list grows. Furthermore, users can also select the product category “other” to model non-default categories. Users have the option to expand their libraries by linking data from the Higg Material Sustainability Index (MSI). As will be described below, the Worldly team uses the best available data to model these materials and products, at the time of writing.
Tool users generate Scope 3 outputs by linking each product to its corresponding Purchase Order (PO) and relevant date information. The linking of products, POs, and dates, enables us to allocate the emissions.
The equation is:
Total Impactstime = ∑ (Product Impactsproduct * Unitsproduct)
| Where | |
| Total Impactstime | All impacts calculated by the tool for the products made during a specific timeframe. |
| Product Impactsproduct | The overall impact calculated for each unique product modeled in the tool during that timeframe. |
| Unitsproduct | The number of units purchased of each product included within that timeframe. |
Every subsequent section of this methodology is focused on the product level, as product-level impacts are aggregated to arrive at the overall tool outputs. Impacts are calculated for a product every time a user adds a purchase order to a product in the Product Impact Calculator. Keeping impacts at the product-purchase order level improves the accuracy of our model outputs because some brands manufacture a SKU in multiple facilities that change across POs.
The Foundational Materials, Component, and Packaging Options
The key inputs to the default product impact models are the materials and components used in the default products. We modeled all of PIC’s generic materials, components and packaging options in the Higg Material Sustainability Index (MSI), with LCA for Experts (formally known as GaBi) serving as the background LCA database (Professional database and extension databases). The Higg MSI methodology is publicly available.2
Materials
PIC’s materials are based on Textile Exchange’s Preferred Fiber & Materials Market Report (PFMMR)3 and the Roadmap to Net Zero: Delivering Science-Based Targets in the Apparel Sector4 working paper from the World Resources Institute and Apparel Impact Institute. The Higg MSI was used to model all three types of representative materials:
- Custom materials - that represent industry averages as defined in the Roadmap to Net Zero: Delivering Science-Based Targets in the Apparel Sector5 working paper;
- Example materials - from the Higg MSI (with an additional heat setting step added); and
- Blended materials - based on the expertise and insights of the Worldly team.
The list also includes non-fiber materials relevant to apparel, footwear, home goods, furniture, and outdoor companies (e.g. wood, aluminum, leather, brass). The materials are reviewed twice yearly and updated in the companion document: PIC Product Category and Material details.
The materials are meant to reflect an industry average of manufacturing processes. At times, this means that the representative materials for textiles are a mix of yarn and textile formation methods that may never be used in the same material in the real world. Because the tool uses representative blends, the impacts for these materials will not exactly match the materials used by brands. Rather, by providing an industry-weighted average, the Product Impact Calculator provides users with a directionally correct starting point. PIC users are encouraged to replace these representative materials with more customized ones that they have modeled in the Higg MSI (additional details are provided PIC Product Category and Material details).
Materials impacts come from Tier 4, (Raw Material Extraction), Tier 3 (Raw Material Processing), Tier 2 (Material Production) and the transportation between those tiers of the supply chain. The inputs, assumptions, and data sources for every material is available to users within the PIC.
Figure 1 - Illustration of the Product Impact Calculator material value chain
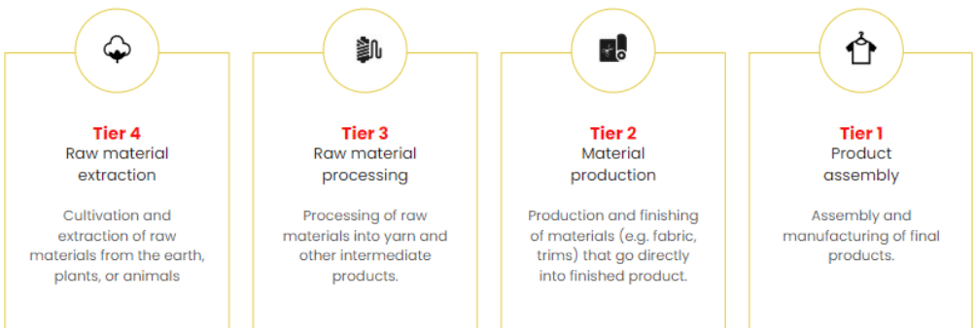
Source: Roadmap to Net Zero (World Resource Institute and Apparel Impact Institute)6
For each tier, the Product Impact Calculator model includes the loss rate7 associated with each step. The loss rate is the percentage of the input from the previous stage or step that is considered waste as part of the process. For example, a 5% loss rate means that for every 1 kg of input, there are 0.95 kg of product output (1 - 0.05 = 0.95). We also include the transportation impacts for moving the material along the supply chain as well as the impacts associated with treating the waste from manufacturing. For transportation, we assume a distance of 200 km traveled by a large truck between each tier of the material supply chain. For transportation from the finalization of the material (Tier 2) to the Manufacturing and Final Assembly (Tier 1), we model a 500 km truck trip; the relevant portion of carbon emissions from this trip are allocated to the material life cycle stage. All default transportation values are taken from the Higg Index Product Module methodology8 (see Appendix A for additional details on transportation modeling). A few examples will help bring this process into focus. Users can use the product library defaults or if more details are available (like specific manufacturing processes) they can alter the defaults to better match their product.
See the two examples below:
Conventional Cotton
To arrive at the conventional cotton in the materials library, we applied the yarn and textile formation estimates provided in Roadmap to Zero9(yarn: 75% ring spun, 25% open ended; textile: 40% knit, 60% woven). To arrive at this mix, four materials were modeled and amalgamated in the Higg MSI:
| Name | Yarn formation | Textile formation | % of Industry Average Blend |
|---|---|---|---|
| Cotton (conventional), ring spun, knit | 75% | 40% | 30% |
| Cotton (conventional), ring spun, woven | 75% | 60% | 45% |
| Cotton (conventional), open end, knit | 25% | 40% | 10% |
| Cotton (conventional), open end, woven | 25% | 60% | 15% |
| Cotton (conventional) industry average | - | - | 100% |
Industry-standard loss rates were applied (available in Roadmap to Zero10) to model the impact of the amalgamated material.
Denim
The inputs for the Product Impact Calculator’s denim were based on the expertise and experience of the Worldly sustainability science team. While there are many ways to manufacture denim, the following is meant to represent a common example. The stages and processes included are:
| Name | Loss Rate | Inbound Transp. Distance |
|---|---|---|
| Cotton fiber, conventional production | 0% | 0 km |
| Spinning, cotton, for woven, open end (rotor) (370 DTEX-333 denier-16/1 Ne-27 Nm) | 17.9% | 200 km |
| Weaving, 370 DTEX-333 denier-16/1 Ne-27 Nm | 2.5% | 200 km |
| Preparation for dye (scouring, etc), woven textile, natural fibers | 2% | 200 km |
| Batch dyeing (incl. piece, jet, jig, kier (fiber), paddle, yarn) - Direct, sulfur, vat or reactive dyes | 8% | 200 km |
| Heat setting, textiles, finishing | 1% | 200 km |
Components
The Product Impact Calculator includes default components from the Higg MSI. Users can update the numbers of units for each component, but the weight and composition of those components cannot be changed (custom components can be created in the MSI tool). A default cutting efficiency of 75% and 1% defect rate 11 are applied from MSI. Table 3 below shows what types of components are available in the tool. See PIC Product Category and Material details for a full list of components.
| Component Types | |
| Button | Stoppers/ Endings |
| Buckle | Zipper/ Chain and Puller |
| Care Label | Zipper/ Chain |
| Shoelaces | Zipper/ Puller |
Packaging
The Product Impact Calculator includes 27 default packaging materials from the Higg MSI. The logic for components applies to packaging as well. All packaging calculations in the tool are on a per unit of product basis. A default cutting efficiency of 75% and 1% defect rate12 are applied from MSI. Users can further customize the packaging, including materials, weights, and cutting efficiency in the MSI tool. Table 4 below shows what types of packaging are available in the tool. For a full list of the packaging options, see PIC Product Category and Material details.
Users can indicate if the product contains a multipack. The number of units in the multipack can be specified and the impacts for a single packaging item are applied.
| Packaging Types | ||
| Bag | Garment cover | Shoebox rope |
| Box | Hanger | Tissue paper |
| Bubble wrap | Hang tag | Toe stuffing |
| Foot form | Shoe sticks | |
The default packaging type for apparel is a Bag (e-commerce/shipping) without a tertiary package (e.g. outer carton) while footwear defaults are a box. Default packaging is included and specified for each product category (See PIC Product Category and Material details) Users who want to add or change the default packaging can select from the set of packaging types and sizes that come with the Product Impact Calculator. Total packaging impacts per product are equal to the sum of all packaging impacts used per product.
The net product weight includes the weight of packaging for all transportation from the gate to product end-of-life. The weight of the packaging is removed from the overall weight when calculating impacts from product use phase. Disposal of packaging is accounted for at the product end of life stage.
Scope 3, Category 1 – Purchased Goods and Services
We start by calculating cradle-to-gate impacts for Scope 3, Category 1 Purchased Goods and Services for each product (BOM = Bill of Materials). Within the text below, we outline the equations, define the variables, and then provide more information in paragraph form, including details on assumptions and data sources. In addition, we describe the average-data method and provide examples for how users can adjust this data or replace this data with primary data to increase model accuracy and move into the hybrid method.
We define Scope 3, Category 1 Purchased Goods for each product as
Purchased Goodspack = ∑ (BOMmat + BOMcomp + Productpack + Final Assembly)
| Where | |
| BOMmat | ∑ = (Material EF) * (Gross Material Weight) * (% Material in BoM) |
| BOMcomp | ∑ = (Component EF) * (No. Components per Product) |
| Productpack | ∑ = (Packaging EF) * (No. Packaging per Product) |
| Final Assembly | [(Assembly EF) * (Product Net Weight)] + (EOL Impacts of Materials Net Loss) |
| And | |
| BOMmat | The impact to manufacture and transport all materials from the raw materials stage to the final assembly facility. We assume a 200km truck trip between each stage of the supply chain. The model also accounts for loss rates between each material processing stage (usually 5%). |
| BOMcomp | The impact to produce all of the components (e.g. zippers) and trims included in a product BOM. |
| Productpack | The impact of the primary packaging for the product. |
| Final Assembly | The impact of the final cut-and-sew processing that occurs in apparel manufacturing. |
BOMmat
These impacts include raw materials through material creation (i.e. the output is a finished fabric). It also includes the transport between stages, which is modeled as a 200km13 trip by large truck. These impact values cannot be altered in the Product Impact Calculator, but are editable by users in the MSI when creating custom materials.
Users have two options for entering the Bill of Materials information. Users can:
-
enter a total net product weight and the percent composition of each material–the material weight is then prorated based on the percent of the product it represents, or
-
enter the gross material amount for each product and net use for each material– net product weight is calculated and not editable. Gross material amount is typically found on a product Bill of Materials (BOM).
For each product, the impact of the materials is the summation of the impact of each material multiplied by material weight. The material weight considers the net use (i.e. amount of material that was lost during final assembly). A default 75% net use is applied based on our understanding of the apparel industry; users can update the net use percentage to better match the efficiency of their product designs. The material weight is then prorated based on the percent of the product it represents. Additional details on the processes used to model each material in the Higg MSI using the LCA for Experts software and database14 were described in the materials section above.
BOMcomp
Components refer to elements beyond materials used in a product such as buttons, zippers, or labels. All PIC components were modeled in MSI and include loss rates, net use, and transportation between stages using the MSI material defaults. Default net use is 75% and the defect rate is 1%. Components can be entered in units and include the weight in kg for the component. An example is a zipper-puller that is made of 0.004 kg of brass material.
The impact calculations for BOMcomp is the Component emission factor multiplied by the number of units of each component used in the product.
Productpack
This includes primary packaging by default; and users can add additional primary and secondary packaging. All PIC packaging options were originally modeled within MSI and put into the Scope 3 library. Within MSI, the packaging was modeled to include loss rates, net use, and transportation between stages. Packaging is entered per unit and includes the material weight. An example is a Small Paper Bag which is made of 0.034 kg paper.
The impact calculations for Productpack is the Packaging emission factor multiplied by the number of units of each Packaging used in the product.
Final Assembly
There are two approaches for calculating Final Assembly: default final assembly impacts and linked Tier 1 facility impacts. Final assembly is calculated by product for each purchase order. A product can have multiple purchase orders with different final assembly options (e.g. one purchase order can use a default assembly option, whereas a second for the product could use Facility XYZ and third purchase order could use Facility ABC).
The default final assembly is applied based on Product Category. Products that are fully formed at the Material Production stage (e.g., formed plastic products or plates and bowls) do not have an additional Final Assembly impact assigned. For apparel and footwear, finished goods manufacturing impacts (Tier 1) are calculated using a standard emission factor per kilogram of finished product (see the World Apparel Life Cycle Database and used in the Roadmap to Net Zero report.15 The default impacts are 1.83 kg CO₂e per kilogram of apparel and 1.99 kg CO₂e per kilogram of footwear, based on a global electricity mix that represents the top apparel-producing countries and includes electricity consumption (approximately 80% of the GHG impact of final assembly), thermal energy, and minor inputs such as tap water. Home textiles use the same factor as apparel.
We conducted literature reviews to estimate a final assembly impact at a category level for products outside of apparel and footwear. The default assembly impact for furniture was modeled by reviewing literature and building a model based on the energy use for assembly of different furniture types
16 For outdoor products requiring assembly, the default assembly impact is based on a model of bicycle assembly processes. For products categorized as “Other,” the default assembly impact represents the average of the modeled categories described above. Some product categories have no additional assembly impact because the necessary processes are already captured in the material production stages. See PIC Product Category and Material details for the full breakdown of product category assumptions. Users can select either “Other with Assembly”, which applies the average of the modeled assembly impacts or “Other without Assembly,” which applies no additional impact at final assembly. These baseline assumptions for any category can be replaced with primary data from the FEM.
The Final Assembly for all products includes a default transportation leg of 500km by large truck from the Tier 2 facility to the Tier 1 facility. 17 The Final Assembly impact also includes impacts from end of life for all of the material that was lost as scrap during the process of making the final product. The amount of scrap is determined by the net use (scrap % = 1-net use %).
In the facility linked option, users can update the Final Assembly impacts by connecting a product’s purchase order to a specific Higg Facility Environmental Module (FEM) that has been shared with the brand. The FEM includes self-reported, and optionally third-party verified, total annual energy usage by energy source and annual production units for the facility. The status of the FEM verification is stated in the tool. When users link a purchase order to a FEM assessment, impacts will be calculated using the primary FEM data in place of the default Final Assembly per unit impact. Users can link products to multiple FEMs, by creating a new PO for each Final Assembler. In 2022 and prior, facilities reported their production volumes in a variety of units including piece/pair and kg. GHG emissions are normalized by dividing the facility total annual emissions by the reported annual production volume. In FEM 2023, production units are standard based on facility type; Final Product Assembly facilities report in pieces/pairs and all other facility types must report in kilograms. When linking a FEM 2023, only Final Product Assembly and/or Finished Product Processing can be linked to the Product Impact Calculator for Tier 1. The normalized GHG emissions of the facility replace the default in the calculation.
If there is no linked FEM, the default apparel assembly assumptions are used. In addition, the Worldly team is actively working on linking the data collected in the Facility Data Manager (FDM).18 Future linkage with FDM data is under consideration.
Scope 3, Category 4 – Upstream Logistics
We define Scope 3, Category 4 Upstream Logistics as:
Upstream Transport = ∑(Ocean + Truck + Air) * (% Up Transport Unowned)
| Where | |
| Ocean | (Ocean EFkg * Oceandistance * Net Product Weight) |
| Truck | (Truck EFkg * Truckdistance * Net Product Weight) |
| Air | (Air EFkg * Airdistance * Net Product Weight) |
| And | |
|---|---|
| Ocean EF | Emissions per kilogram per kilometer (kgkm) |
| Truck EF | Emissions per kilogram per kilometer (kgkm) |
| Air EF | Emissions per kilogram per kilometer (kgkm) |
| Net Product Weight | Weight of the final product materials and components plus the packaging weight. |
| % Upstream Transport Unowned | % of transport not owned by the company that is therefore included in Scope 3 (the owned part is included in Scope 1) |
Upstream logistics incorporates the distance a product travels from the final assembly (gate) to the distribution center. We assume that every product travels across a mix of ocean (14,850 km), truck (1,000 km), and air (1,750 km) to arrive at the distribution center. These values are fixed and not editable by the user today. These transport impacts are multiplied by the net product weight (materials, components, and packaging) to arrive at the overall per product unit transportation impact. This aggregated number is then allocated to Scope 3 based on the percentage of the transport that is included in unowned third party. Our default assumption is that 100% of this Upstream transportation takes place in third-party transportation assets. Users can update this percent owned value for upstream logistics at the brand level. Users can also change the percentage assigned through brand-owned and third-party distribution networks at the brand level.
The transportation modality and distance blend required to get the product to the distribution centers come from a prior draft Apparel and Footwear Product Environmental Footprinting Category Rules (PEFCR)19 for the Apparel and Footwear industries. The transportation values modeled are:
| Transportation Modality | Final Assembly to Distribution Center Distances (km) | Total GHG per kg Product (in kgCO2e) |
|---|---|---|
| Ocean | 14,850 | 0.064 |
| Truck | 1,000 | 0.067 |
| Air | 1,750 | 1.07 |
| TOTAL | 17,600 | 1.2 |
Scope 3, Category 9 – Downstream Transportation and Logistics
The Downstream Transportation and Logistics calculation has two parts: 1) transportation from the distribution center to a retail store or e-commerce customer; and 2) the electricity and natural gas required to operate distribution centers and retail stores. We define Scope 3, Category 9 Downstream Transportation and Logistics as
Downstream Logistics = ∑ (Downtransport + Downdc + Downretail)
| Where | |
| Down transport | Downstream Transport EFunit * (Product Net Weight * % Transport Unowned) |
| Downdc | DC Emission Factorunit * (% Distribution Centers Unowned) |
| Downretail | (Retail Store Emission Factorunit) * (% of Retail Unowned) |
| And | |
| Downtransport | The impact of transporting the product from the Distribution Center to the Retail Store or e-commerce customer. This is calculated based on the net weight of each product and the percentage of transportation assets not owned by the brand, as those would be included in Scope 1. |
| Downdc | The percentage of emissions from running the distribution center allocated to each unit. |
| Downretail | The percentage of emissions from running the retail stores allocated to each unit. |
| Net Product Weight | The weight of the final product materials and components plus the packaging weight. |
Downtransport is the per kilogram emissions from transporting the product from the distribution center to the Retail Store of e-commerce customer multiplied by the product net weight (materials, packaging, and components) in kilograms to arrive at the overall per product unit transportation impact. The default distance and modalities for retail and ecommerce transportation are 1,000 km and large truck, respectively. The Global Warming Potential is calculated per kgkm. Like with upstream transportation, a percent ownership is applied to the total impacts to avoid applying Scope 1 impacts to the Scope 3 logistics.20 Our default assumption is that 50% of this Downstream transportation takes place in third-party transportation assets. Users can update this percent owned value for downstream logistics in the tool. Retail Center to Consumer transport (i.e. consumer driving from the retail store to their home) and any transportation related to returns are excluded.
| Variable | Unit | Source |
|---|---|---|
| Transportation impact | Per 1 kgkm | EU-28: Transport, truck-trailer (40 t total cap., 24.7 t payload) |
Downdc is the impacts allocated to each unit related to the impacts of running a distribution center. They are calculated on a per product unit basis by multiplying the default electricity and natural gas usage by the default global emissions factors that is based on a global electricity mix put together by Cascale (formerly the Sustainability Apparel Coalition). The per product unit emissions from distribution center electricity (0.065 kWh per unit) and natural gas (0.215 kWh) consumption are fixed and drawn from the most recent updates to the Higg Product Module; they were initially created using data and expertise from Cascale members. A global electricity mix based on domestic consumption was used to represent the emission factors for distribution center locations. The distribution center impacts are then allocated to Scope 3 based on the percentage of the Distribution Center work that occurs in unowned third party facilities. Our default assumption is that 50% of this Distribution Center impact takes place in third-party assets. Users can update this percent owned value for the distribution center in the Product Impact Calculator.
Downretail impacts are calculated on a per product unit basis. Impacts are calculated by multiplying the electricity used (0.75 kWh per unit) by the relevant emissions factor. A global electricity mix based on domestic consumption was used to represent the emission factors for retail locations.21 The per unit emissions from retail stores is fixed and drawn from the Higg Product Module; they were initially created using data and expertise from Cascale members. All products are considered one unit; the weight or size of each product is not reflected in this default. The Retail impacts are then allocated to Scope 3 based on the percentage of the retail that occurs is unowned third party retail stores (e.g. a multi-brand retail store. Our default assumption is that 50% of this Retail takes place in third-party stores.22 Users can update this percent owned value for retail stores in the Product Impact Calculator.
Electricity and natural gas consumption are the two inputs to the emissions from Distribution Centers and Retail stores.23 The per unit impacts are:
| Electricity (kWh) | Natural Gas (kWh) | |
|---|---|---|
| Distribution Center | 0.065 | 0.215 |
| Retail | 0.75 | 0 |
Scope 3, Category 11 – Use of Sold Products
We define Scope 3, Category 11 Use of Sold Products as:
Product UseImpacts= (Net Product Weight) * (Lifetime Washes) * (Washing EF)
| Where | |
| Net Product Weight | The weight of the final product materials and components plus the packaging weight. |
| Lifetime Washes | The number of total expected wears divided by the number of times worn between each washing. |
| Washing EF | The emissions associated with each kg of clothing laundered. |
Use phase impacts are limited to apparel and home textiles products. All other products do not have use phase assumptions built into the product models. The per unit use phase impacts are calculated by dividing the total expected number of lifetime uses (wears) by the numbers of times worn between each cleaning. This provides the total number of times that the product will be cleaned. The number of cleanings is then multiplied by the sum of the impacts of cleaning the product. These total product lifetime cleaning impacts are then multiplied by the net weight of the product, as the allocation of impacts from washing and/or drying a product is done on a weight basis. The way in which a product is cleaned is based on the product type and some products (such as footwear) do not have any associated washing and care cycles. Details are provided in the Product Care section below and Appendix F.
The product category for the default product impact models is used to determine how often the product is washed and the type of care for the default fabric. The default material for all categories is cotton except for hosiery, for which the default material is synthetic. The default approach to drying for all categories is “Line/Air Dry” and “No Ironing.” Product weight is the key driver of product care impact; it is assumed that each load of laundry includes 4 kg of apparel, with impacts being allocated based on product weights. A subset of these assumptions is provided below.
| Product Category | Fabric Category | Standard Consumer Care Practice | Standard Use Frequency b/w Washes | Lifetime Uses |
|---|---|---|---|---|
| T-Shirt | Cotton | Machine Wash Warm, Line/Air Dry | 1.5 | 46 |
| Pants | Cotton | Machine Wash Warm, Line/Air Dry | 4.2 | 66 |
| Socks | Cotton | Machine Wash Warm, Line/Air Dry | 1.5 | 52.3 |
Scope 3, Category 12: End-of-Life Treatment of Sold Products
We define Scope 3, Category 12 End-of-Life (EOL) Treatment of Sold Products as:
Product EOLimpacts = (Net Product Weight) * (End of Life Emission Factor)
| Where | |
| Net Product Weight | The weight of the final product materials and components plus the packaging weight. |
| EOL Emission Factor | The emissions associated with the End-of-Life treatment of each kg of clothing. |
For each unit of a product, the end-of-life impact is calculated by multiplying the product net weight by the default final disposal impact per kg of product. The Final Disposal Impact is a blended impact for which we assume that 31.5% of products are sent to a municipal waste incineration plant, 63% are sent to a landfill, and the remaining 5.5% are recycled by consumers. As we are using the cut off approach for recycling, there is no environmental impact associated with product recycling.
| Variable | Value (kg CO2e) | Unit | Source |
|---|---|---|---|
| Disposal impact for materials at assembly stage | 0.961 | Per kg waste | 31.5%- Commercial waste in municipal waste incineration plant 63%- EU-28: Commercial waste (AT, DE, IT, LU, NL, SE, CH) on landfill 5.5%- Recycling |
Appendices
Appendix A: Transportation Modeling Specifics
| Transportation Leg | Lifecycle Stage | Scope 3 Category | Modeling Assumptions |
| Between nodes in the supply chain from raw materials (Tier 4) to the completion of the material (Tier 2) | Materials | Scope 3, Category 1 - Purchased Goods and Services | The default value of 200km by large truck for each production stage. This cannot be updated in the Product Impact Calculator, but can be adjusted in the Higg MSI. |
| Transportation from material finalization location (Tier 2) to manufacturing final assembly (Tier 1) | Materials | Scope 3, Category 1 - Purchased Goods and Services | The default value is 500km by large truck for each material. This cannot be updated in the Product Impact Calculator, but can be adjusted in the Higg Product Module. |
| Transportation from manufacturing final assembly (Tier 1) to the distribution center. | Upstream Logistics | Scope 3, Category 4 - Upstream Transportation and Distribution | Default value of 14850km by ocean freight, 1000km by large truck, and 1750km by air freight. This assumption is from the draft Apparel and Footwear PEFCR. This is adjustable by the user if data is available |
| Transportation from distribution center to retail stores. | Downstream Transport and Distribution | Scope 3, Category 9 - Downstream Transportation and Distribution | The default value is 1000km by large truck for each material. This cannot be updated in the Product Impact Calculator, but can be adjusted in the Higg Product Module. In addition, we assume that 70% of products are transported from the distribution center to the retail stores in brand-owned assets. This means that only 30% of impacts from this transportation leg are allocated to Scope 3, Category 4; the impacts from the remaining 70% are not included in the Product Impact Calculator output. Product Impact Calculator users can change this weighting at the overall business level within the Higg Product Module settings. |
| Transportation direct from distribution center to customers. | Downstream Transport and Distribution | Scope 3, Category 9 - Downstream Transportation and Distribution | The default value is 1000km by large truck for each material. This cannot be updated in the Product Impact Calculator, but can be adjusted in the Higg Product Module. In addition, we assume that 70% of products are transported from the distribution center to the customer in brand-owned assets. This means that only 30% of impacts from this transportation leg are allocated to Scope 3, Category 4; the impacts from the remaining 70% are not included in the Product Impact Calculator output. Product Impact Calculator users can change this weighting at the overall business level within the Higg Product Module settings. |
Appendix B: Washing Scenarios
Washing machine assumptions are included below. Product lifetimes and lifetime washes are sourced from Higg Index Product Module methodology.24 For simplicity, the Product Impact Calculator does not consider the fabric category, but defaults to the cotton care scenario for all products.
| Washing Scenarios | |||
|---|---|---|---|
| Washing temperature | Cold 20C (68F) | Warm 40C (104F) | Hot 60C (140F) |
| Load | 4kg | ||
| Energy consumption for normal washing cycle | 0.79 kWh/load | ||
| Energy for heating the water for the wash |
0 kWh 0 MJ NG |
0.979 kWh 5.129 MJ NG |
1.957 kWh 10.259 MJ NG |
| Water consumption | 9 L/load | ||
| Water Use | 70 L/load | ||
| Quantity of wastewater | 61 L/load | ||
Appendix C: Change Log
| Version | Change |
| 1.1 |
|
| 2.0 |
|
- See Chapter 1, Purchased Goods and Services in "Technical Guidance for Calculating Scope 3 Emissions", GHG Protocol (PDF)↩︎
- Higg MSI Methodology ↩︎
- Preferred Fiber and Materials Market Report 2022, Textile Exchange↩︎
- Roadmap to Net Zero: Delivering Science-Based Targets in the Apparel Sector ↩︎
- Roadmap to Net Zero: Delivering Science-Based Targets in the Apparel Sector ↩︎
- Roadmap to Net Zero: Delivering Science-Based Targets in the Apparel Sector ↩︎
- The loss rate assumptions come directly from the Higg MSI. Those loss rates were determined using “values from secondary data sources, expert guidance, and industry methodology such as Textile Exchange’s Fiber Conversion Methodology.” See the MSI methodology for additional detail. ↩︎
- Roadmap to Net Zero: Delivering Science-Based Targets in the Apparel Sector ↩︎
- Roadmap to Net Zero: Delivering Science-Based Targets in the Apparel Sector ↩︎
- Roadmap to Net Zero: Delivering Science-Based Targets in the Apparel Sector↩︎
- Higg MSI: Creating Customized Trims/Components and Packaging ↩︎
- Higg MSI: Creating Customized Trims/Components and Packaging ↩︎
- See Production Stage assumptions. Based on industry expertise. ↩︎
- LCA for Experts (GaBi) ↩︎
- Roadmap to Net Zero: Delivering Science-Based Targets in the Apparel Sector ↩︎
- Gonzalez-Garcia, et al.,“Assessing the global warming potential of wooden products from the furniture sector to improve their ecodesign” (2011) ↩︎
- Higg PM: See Logistics section ↩︎
- Facility Data Manager ↩︎
- Environmental Footprint Methods ↩︎
- A 50% ownership is assumed and applied, though tool users have the ability to alter this assumptions ↩︎
- See Higg PM Retail section ↩︎
- Higg PM ↩︎
- Electricity Domestic Consumption World Energy & Climate Statistics – Yearbook 2025 ↩︎
- Table 8: Product Care Scenarios. Higg PM ↩︎